

Key facts
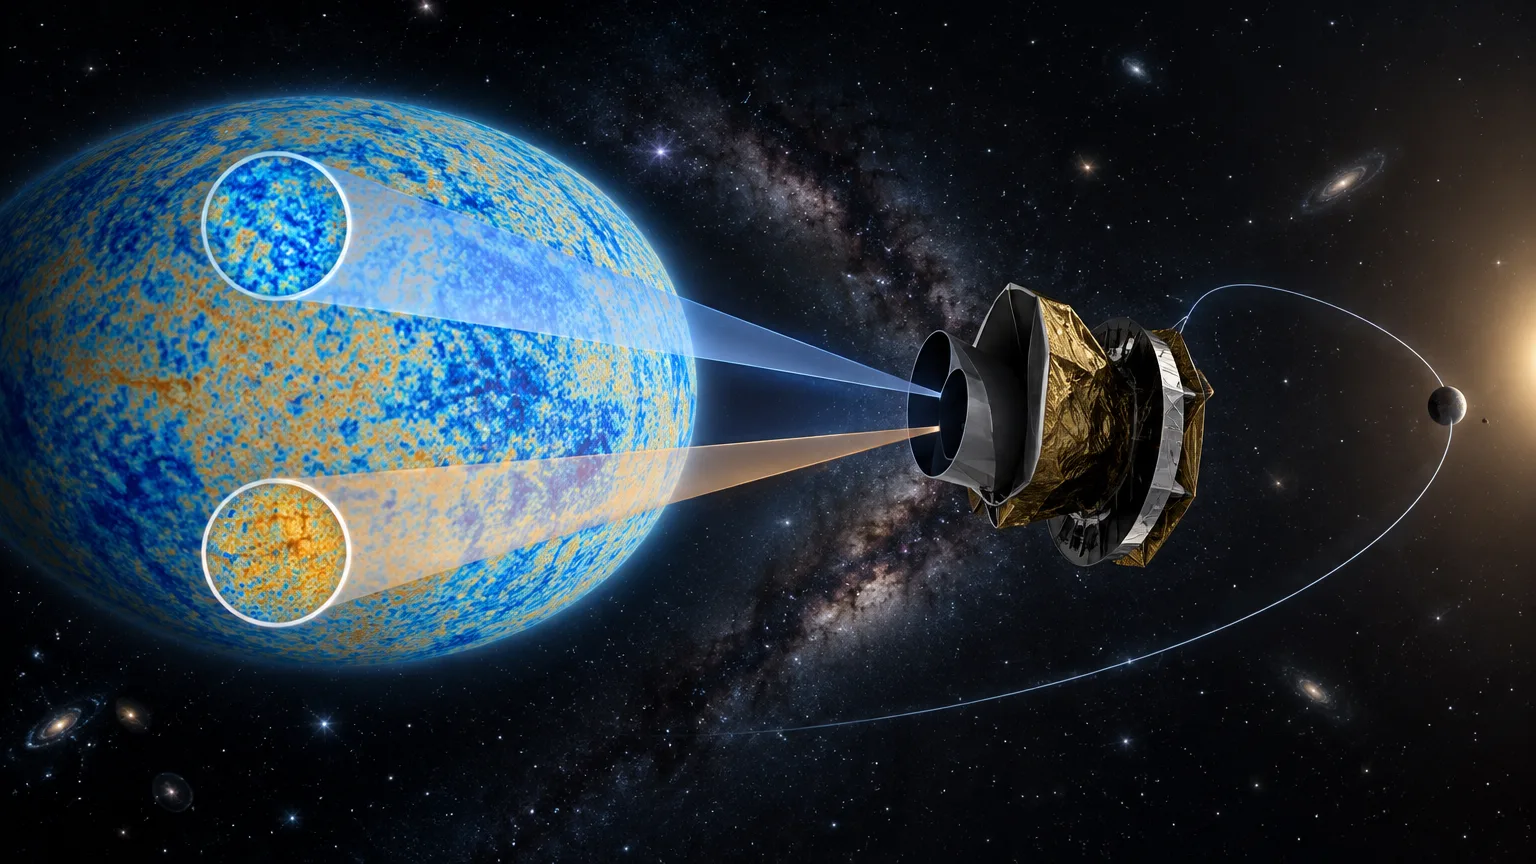
- WMAP measured temperature variations in the cosmic microwave background, radiation released about 375,000 years after the birth of the universe.
- The instrument compared the temperatures of two regions of the sky and observed in five frequency bands, from 22 to 90 GHz.
- The probe produced the first all-sky map of the microwave background with a resolution of 0.2 degrees.
- WMAP was launched on June 30, 2001, and traveled to L2 on a lunar-assisted trajectory.
- The nominal plan called for 27 months: three in transit to L2 and 24 observing; the mission was extended to gather additional data.
- NASA attributes to WMAP an estimate of the universe’s age of 13.77 billion years, with a margin of half a percentage point.
Related records
The Wilkinson Microwave Anisotropy Probe (WMAP) was a NASA probe dedicated to measuring small temperature differences in the cosmic microwave background radiation. This radiation, which fills the sky, was released about 375,000 years after the birth of the universe. Its variations, though tiny, contain information about conditions in the early cosmos and the primordial structure from which galaxies formed.
The instrumental challenge was to distinguish these faint signals and create a map of the entire sky. WMAP’s solution was not to take isolated measurements of absolute temperature: the instrument compared regions of the sky, observed at several frequencies and repeatedly scanned different directions. NASA attributes to its measurements information about the size, age, geometry and matter content of the universe. These are cosmological results derived from the observations; they should not be confused with the instrument’s physical characteristics.
An ancient signal, with minute differences
In this context, the cosmic microwave background is the oldest radiation observed by WMAP. The probe mapped temperature variations by direction in the sky, known as anisotropies. To give an idea of their scale, NASA cites one region with a temperature of 2.7251 K and another with 2.7249 K. The difference is small, but its distribution makes it possible to study conditions in the early universe.
The mission had a predecessor: in 1992, the Cosmic Background Explorer (COBE) satellite detected temperature differences on large angular scales. According to NASA, WMAP measured these anisotropies in greater detail and with greater sensitivity than COBE. The team produced the first all-sky map of the microwave background with a resolution of 0.2 degrees, depicting the radiation’s tiny fluctuations.
Comparing two regions instead of measuring an absolute temperature
WMAP was a differential experiment: it measured the temperature difference between two points in the sky rather than determining each point’s absolute temperature separately. The idea is to compare two signals directly. This allowed the instrument to search for variations between regions and combine comparisons from many areas in the complete map.
The instrument used passively cooled microwave radiometers connected by metal straps to radiator panels. It also observed in five frequency bands, from 22 to 90 GHz. NASA says this coverage was designed to make it easier to separate foreground Galactic signals from the cosmic background radiation. In other words, the bands helped distinguish emissions that overlap in observations of the sky.
Measuring extremely small temperature differences required attention to possible systematic errors. WMAP’s design therefore brought together differential comparison, multiple frequencies and thermal management of the observatory. NASA’s material describes these as instrumental choices for measuring the microwave sky with high precision.
The orbit and scanning pattern
WMAP was launched on June 30, 2001, on a lunar-assisted trajectory toward L2, the Sun–Earth system’s libration point located, according to NASA, one million miles from Earth. The spacecraft orbited around that region. NASA describes L2 as a thermally stable environment and says the configuration allowed an observing efficiency close to 100%, with the Sun, Earth and Moon behind the instrument’s field of view.
The spacecraft itself kept the instrument continuously in the shadow of the Sun, Earth and Moon to reduce thermal disturbances. The observing strategy combined a rapid spin around the spacecraft’s symmetry axis with a slow precession of 22.5° around the Sun–WMAP line. Each telescope line of sight was about 70° from the axis. According to NASA’s description, this motion traced a pattern that reached the north and south ecliptic poles and allowed numerous sky pixels to be compared over time.
From observations to the properties of the universe
The differences recorded by WMAP helped scientists study the size, matter content, age and geometry of the universe, as well as the primordial structure that grew into galaxies. NASA attributes to the mission an estimate of the universe’s age of 13.77 billion years, with a margin of half a percentage point. This figure is a cosmological inference based on the measurements, not a direct reading from a clock on board.
The initial plan envisaged a nominal mission of 27 months: three months in transit to L2 and 24 months of observations. The mission was extended to collect additional data. Operations ended in 2010, and data analysis was completed in 2013. Thus, the scientific campaign lasted longer than the nominal plan, while subsequent processing continued after operations ended.
What the map allows us to conclude
WMAP shows how a probe can turn tiny differences into a tool for studying the cosmos. Differential measurement, the five bands, control of thermal disturbances and an all-sky scan were all part of the method. The resulting map made it possible to investigate cosmological properties from the distribution of ancient radiation; for example, NASA’s reported age estimate is given with an estimated precision of half a percentage point.
The evidence described by NASA concerns WMAP’s measurements and the properties the team derived from them. Variations in the cosmic background are the observed signal; the age, geometry and contents of the universe are cosmological interpretations built from that signal. This distinction helps explain both the map’s scope and the role of the design choices that made it possible.