

Key facts
- According to ESA, Gaia lists parallaxes and proper motions for more than 1.3 billion stars.
- NASA says SPHEREx plans to release an all-sky map in 102 wavelengths after its one-year milestone.
- According to a NASA MDSCC page, Euclid will create by 2030 a map covering nearly one-third of the sky.
- A secondary source attributes a map of 17.3 million cosmic sources to LOFAR.
Related records
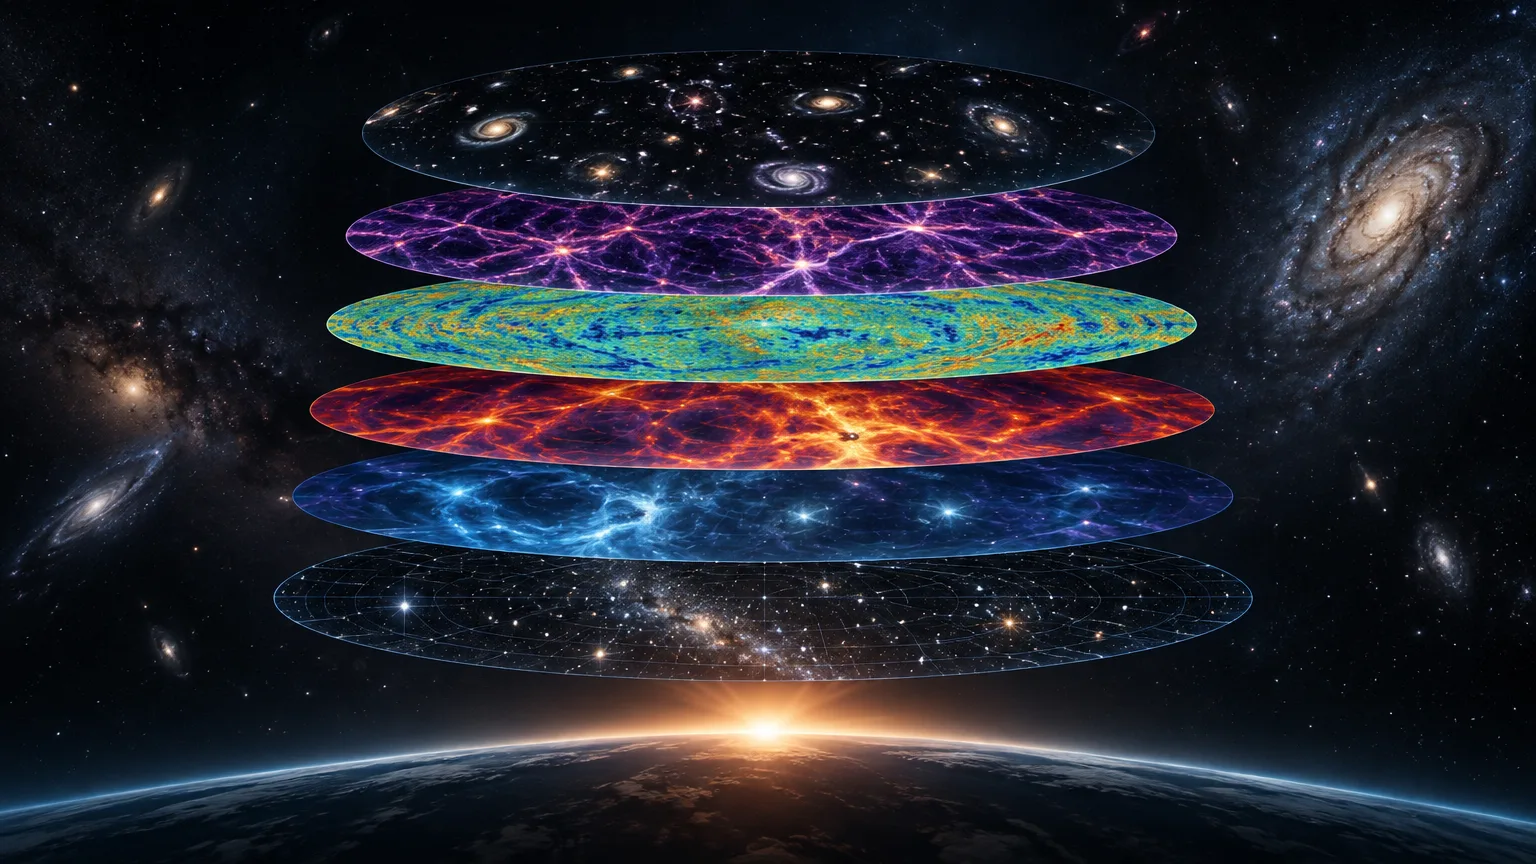
Speaking of sky maps does not necessarily mean speaking of one final, definitive image of the universe. One catalogue may record star positions; another may measure their apparent motions; another may observe the same sky at many wavelengths. Some surveys are also intended to reconstruct, indirectly, components that cannot be seen directly, such as dark matter. The evidence assembled here places several of these approaches in context, but it does not justify turning them into a single complete census of the cosmos.
A map depends on the scientific question
Astronomical mapping turns observations into comparable data: positions, motions, brightness, or signals collected in different parts of the spectrum. Two projects can therefore both be called “maps” while answering very different questions. A stellar inventory helps describe our galaxy; a multi-band map provides information about how objects emit light; broad sky coverage enables the study of large-scale structures.
This distinction matters because the number of objects alone cannot establish which map is “best.” The area covered, the observed object class, the kind of measurement, resolution and observing period all matter. A result may be exceptionally detailed for one population while leaving out much of what another instrument was designed to measure.
Gaia: positions and motions for more than 1.3 billion stars
The European Space Agency (ESA) presents Gaia as a mission that has created the most complete stellar map of our galaxy and beyond. According to the available information, its catalogue lists parallaxes and proper motions for more than 1.3 billion stars.
Parallax is an apparent positional shift used to infer astronomical distances. Proper motion describes a star’s apparent displacement across the sky over time. Together, these measurements do more than place dots on a sky chart: they help reconstruct how stars are distributed and move. That is the difference between a still image and a kinematic map of the Milky Way.
The cited figure specifically concerns stars with those measurements in the referenced catalogue. It should not be read as a count of every object in the universe or as a direct measurement of all matter in the galaxy.
SPHEREx: the sky in 102 wavelengths
NASA says that the SPHEREx mission plans, after reaching its one-year milestone, to release an all-sky map in 102 wavelengths. A wavelength identifies a portion of the light spectrum; observing many of them makes it possible to distinguish information that does not appear in a single observing band.
The timing qualifier is crucial: the source describes a planned release after that milestone. With the supplied evidence, it is therefore not appropriate to state that the product has already been released or to assign scientific findings that the source does not detail. What is established here is the plan to share a multiwavelength all-sky map and the number of wavelengths specified by NASA.
Euclid and wide-coverage mapping
A page from NASA’s Madrid Deep Space Communications Complex states that Euclid will create, by 2030, a cosmic map covering nearly one-third of the sky and using a much wider field of view than space telescopes. The same source defines dark energy as the name given to the unknown source associated with the universe’s increasingly rapid expansion.
In this context, “nearly one-third” expresses a coverage target, not a completed observation in the available excerpt. A broad map is scientifically valuable because it allows comparisons between distant sky regions and searches for large-scale statistical patterns. Yet extensive coverage alone does not remove limits related to sensitivity, observing time or interpretation.
LOFAR and the value of specialized censuses
A secondary news source reports that the LOFAR project produced a map containing 17.3 million cosmic sources and calls it, at that point, the most complete census of actively growing supermassive black holes. The figure illustrates another mapping principle: a survey can target a specific physical class of sources rather than portray all celestial bodies equally.
Because this claim comes from a non-primary source in the supplied material, it should be treated cautiously. The original study, methodology and reference date needed to assess the “most complete” description are not provided here. It nevertheless illustrates how modern maps can act as specialized censuses of energetic phenomena rather than merely visual atlases.
How to read the comparisons—and their limits
The cited projects do not necessarily compete in the same category. Gaia supplies precise stellar measurements; SPHEREx plans an all-sky survey in 102 wavelengths; Euclid has a goal of covering nearly one-third of the sky by 2030; and LOFAR, according to a secondary source, gathers millions of sources with a specific focus. Their figures are not interchangeable.
It is also important to distinguish published results, plans and third-party headlines. The evidence does not include a SPHEREx data-release date, additional technical details for Euclid, or LOFAR’s primary paper. Nor does it support a conclusion that any one project offers the definitive map of the universe. It does show a field advancing through complementary maps, each turning a different part of the sky into useful measurements for investigating the cosmos.