

Key facts
- The historical map from the DESI Legacy Imaging Surveys covered half the sky and included more than one billion galaxies.
- The digital mosaic had 10^12 pixels and combined images from Kitt Peak, Cerro Tololo, and WISE.
- The map brought together three surveys: MzLS, DECaLS, and BASS; its creation took six years and 1,405 observing nights.
- The DESI plan described in 2021 envisaged selecting 35 million galaxies and 2.4 million quasars for spectroscopy.
- DESI separates light into bands of color and measures distances and rates of recession; its system has 5,000 robots with optical fibers and is designed to measure up to 5,000 galaxies at a time.
- The 2021 announcement planned five years of operations for the DESI survey.
Related records
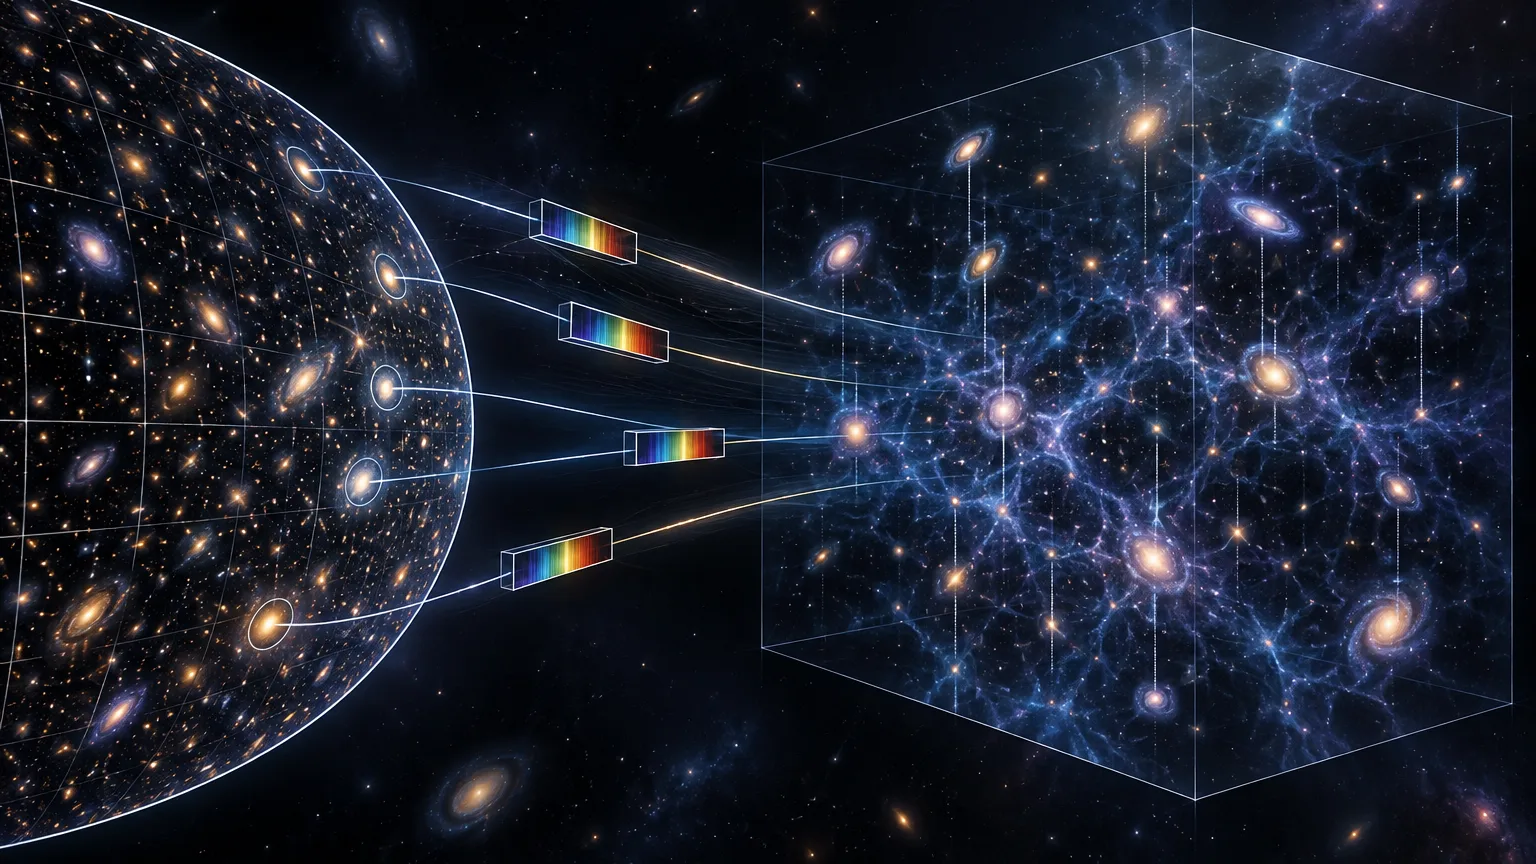
A celestial map can look like a highly detailed image of the universe, but an image alone does not necessarily show how far away each galaxy is. The DESI Legacy Imaging Surveys and the Dark Energy Spectroscopic Instrument (DESI) have different but complementary roles: the former assembled images that make it possible to locate objects in the sky; the latter observes the light from a selection of those objects to obtain information about their distance and motion.
The connection between the two illustrates how we move from two-dimensional mapping to three-dimensional mapping. The map places objects on the sky; DESI’s spectroscopic measurements provide information that also arranges them in depth. NOIRLab presented the project in January 2021 as the basis for the DESI survey. The figures below describe that map and the plan announced at the time, not an up-to-date count of all known celestial objects.
An image map for locating objects
The Legacy Imaging Surveys combined images taken at Kitt Peak National Observatory in Arizona and Cerro Tololo Inter-American Observatory in Chile. The collection was supplemented with images from WISE, NASA’s Wide-field Infrared Survey Explorer space telescope. The resulting map covered half the sky and brought together more than one billion galaxies.
The digital coverage extended to ten trillion pixels—1012 on the numerical scale used in Spanish. The project described the map as the largest made up to that point when considering together the area of sky covered, sensitivity, and total number of galaxies mapped. It was not a single exposure: the images came from three surveys, MzLS, DECaLS, and BASS, and from a six-year effort that accumulated 1,405 observing nights.
The scale of the work also gives an idea of the project’s size: NOIRLab’s announcement put the data volume at one petabyte and the processing effort at one hundred million CPU hours. Together, the images and their processing made it possible to prepare a catalog for deciding which objects to observe next with DESI.
Selecting targets for DESI
The image map’s role was not to measure the distances of all objects by itself. It was used to locate candidates and select targets for the spectroscopic survey. In the plan described in 2021, the DESI collaboration expected to select 35 million galaxies and 2.4 million quasars. According to the announcement, some of those objects were as far away as 12 billion light-years.
A quasar is one of the types of objects included in DESI’s selection; in this context, the important point is that both galaxies and quasars can be targets for spectroscopic measurements. The map made it possible to identify them and direct observations toward them. In this way, the two-dimensional catalog served as a guide for organizing the subsequent work, not as a substitute for the measurements that add the dimension of depth.
What a spectrum adds
To obtain a spectrum, DESI separates the light from each galaxy into narrow bands of color. The distribution of that light allows the team to measure distances and the rate at which galaxies are moving away from us, according to the project description. By linking those measurements to each object’s position on the sky map, researchers can build a three-dimensional representation: they know not only which region to look toward, but also how objects are distributed along cosmic depth.
The instrument automates observations using 5,000 movable robots. Each one carries a thin optical fiber that can be pointed at an individual galaxy; the design makes it possible to measure the spectra of up to 5,000 galaxies at a time. This capability makes it possible to work with a very large selection of objects during the survey, which the announcement planned to run for five years.
From positions to three-dimensional structure
The image map and the 3D map therefore answer different questions. The first describes the distribution of sources across the celestial sphere and helps prepare the selection of targets. DESI adds light measurements that make it possible to place objects in depth and record how fast they are moving away. The intended result is a more complete map of the distribution of galaxies and quasars in the universe.
NOIRLab explained that DESI’s measurements could provide information about the nature of dark energy, which the announcement associated with the accelerated expansion of the universe. This scientific goal depends on the full set of observations and their analysis: the image map is a preparatory stage, while the spectra provide the measurements needed to trace the three-dimensional distribution.
The central idea is simple, even though carrying it out requires extensive infrastructure: first, broad, uniform images help locate and select objects; then, optical fibers collect their light and DESI separates it into colors. By combining sky position with spectroscopic measurements, a flat map becomes the starting point for measuring how the universe is organized in three dimensions.